Table of Contents
Widgets
Widgets are like mini-reports generally represented as graphs. These widgets can be used in ChekMate and ChekTV. You can create widgets to quickly get an understanding of what is happening with your ChekRite data. e.g. How many inspections have been completed today? How many issues have been recorded per week for the last 6 weeks. It is very easy to create widgets.
Widgets
Each widget represents a discrete set of information from your ChekRite data. A widget can display information in multiple ways, such as:
KPI | A single numeric value. e.g. Total transactions this week. |
Bar Chart | A bar chart representing information usually over time or grouped some other way. |
Line Chart | A line chart representing information usually over time. |
Pie Chart | A pie chart grouping together information often independent of time. |
Image | A special widget to allow you to load up your own images such as an internal company message from HR or the company results. These are mostly used in ChekTV to intersperse data from ChekRite with other company information. |
To create a widget:
- Navigate to Widgets > Widgets.
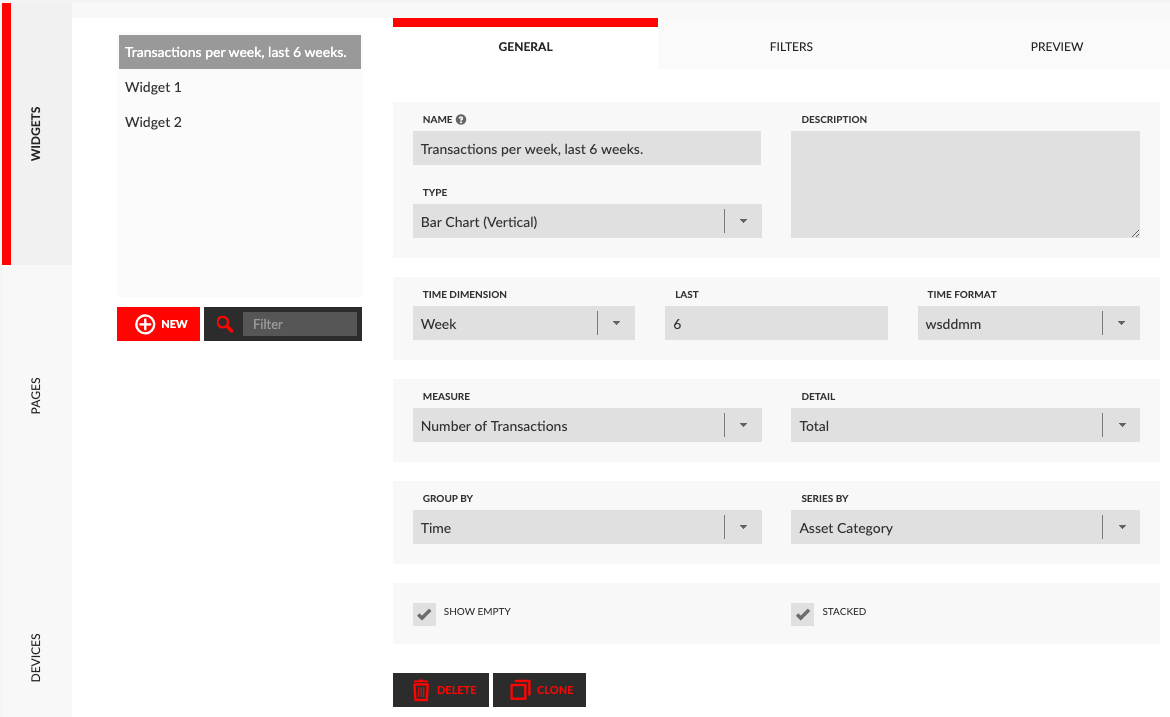
- Enter the Name of the widget.
- Enter a Description describing what this widget displays.
- Select the Type of the widget (see list of types above).
- Select the Time Dimension, Last (how far back to look), and Format. For example, this might be Daily for the last 7 days, Weekly for the last 6 weeks or monthly for the last 3 months. You decide how far back to look when populating this widget.
- Select the Measure & Detail. This measure describes what you are looking for. e.g. this could be the total number of transactions (inspections), or the average duration of transactions. Depending on what Measure you choose, you will see different detail options.
- Select the Group By & Series By values (not used for KPI). Generally, you will want to Group By the time measure, meaning if you are looking for transactions per week for the last 6 weeks, then you would group by time to group together the transactions for each week. After that you can optionally break this down further with the Series By value.
- Optional: Decide to Show Empty groups. i.e. if there have been no transactions in that week, show that or just show those weeks with transactions.
- Optional: If you have selected Series By you will have the option to Stack identical values.
Once you have defined your widget, you may wish to Filter out certain values. You can do this from the Filters tab.
Pages
If you are using ChekTV, you may want to put multiple widgets on a single page to create a real-time dashboard. In fact, you can have multiple pages on a single ChekTV and the app will scroll through them at the defined intervals.
Devices
You can have multiple ChekTV's displaying different content depending on their location and the audience that will normally view them. This is where you can define what each of those ChekTV's will display.